
Home
The dashboard — a read-only summary of how your phones have been running, with a calm overview and a detailed full view.
Home is the dashboard you land on after signing in. It is a read-only summary of how your phone system has been performing — call volumes, answer rates, talk time, quality, and live status. Nothing here changes settings; it is the place to glance each morning, and the jumping-off point into Call Analytics when something needs a closer look.
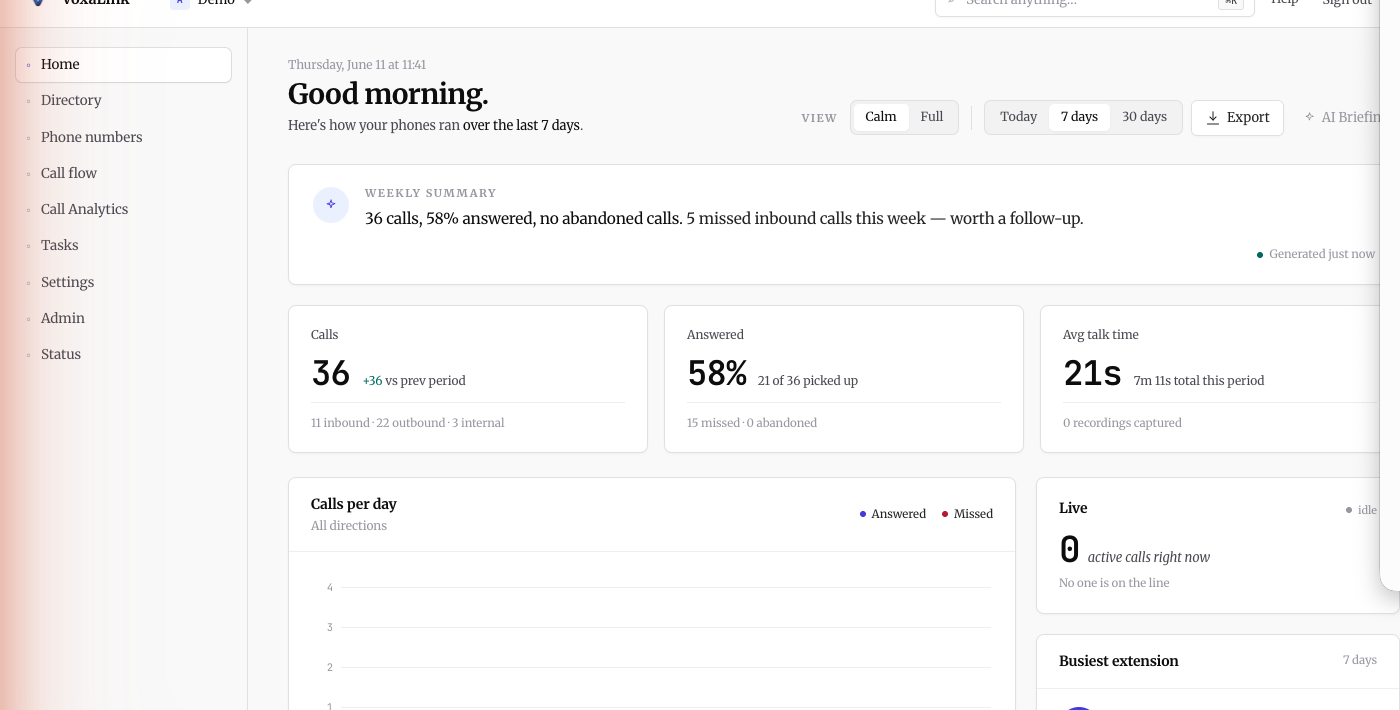
Reading the dashboard
Three controls at the top shape everything below them:
- Date range — Today, 7 days, or 30 days. Every metric and chart on the page reflects the range you pick. The default is the last 7 days.
- View — Calm or Full — Calm shows the handful of numbers most people want at a glance; Full expands the same data into a detailed operations view with extra breakdowns and charts. It only changes how much is shown, never the underlying data.
- Export — downloads the current dashboard data for the selected range.
There is also an AI Briefing control that produces a detailed, on-demand write-up of the selected period — see AI Briefing below.
The weekly summary
At the top sits an AI-written summary of the selected period in plain English — for example, "28 calls, 46% answered, no abandoned calls. 2 missed inbound calls this week — worth a follow-up." It highlights the things worth noticing (missed calls to chase, abandoned calls, unusual volume) so you do not have to read the numbers to get the gist. It regenerates for the range you choose and notes when it was last generated.
AI Briefing
The AI Briefing button in the top bar (next to Export) generates a richer, on-demand write-up of the period you are looking at — think of it as the weekly summary's more detailed sibling, produced only when you ask for it.
Clicking it opens a panel. Nothing is generated — and nothing is spent — until you press Generate; simply opening the panel costs nothing. The briefing always covers the date range currently selected at the top of the dashboard (Today, 7 days, or 30 days). Switch the range and generate again to get a fresh briefing for that window.
What it gives you:
- Headline — one line capturing the period at a glance: volume, answer rate, and anything notable versus the period before.
- Highlights — up to four short observations worth your attention, such as a run of missed calls, a shift in sentiment, or an unusual change in volume. If nothing stands out, this is left empty rather than padded.
- Notable calls — a note on each call worth a closer look, and why. Each links straight through to the recording and detail in Call Analytics.
- Suggested action — a single next step to consider (for example, a follow-up to make), shown only when there is genuinely something to act on.
A finished briefing reads like a short note from an assistant. For a 7-day range it might open with a headline such as "47 calls, 89% answered — up 7 points on the week before," highlight "3 missed inbound calls to the sales line on Tuesday afternoon — one caller tried three times" and "one negative-sentiment call about a delayed order," list those calls as clickable links, and finish with "Suggested: follow up the missed Tuesday sales calls."
Everything is grounded in your actual call data — the briefing will not invent numbers, names, or calls that are not there. Use Copy to lift the text into an email or note, or Regenerate to produce a fresh take. A line at the bottom shows when it was generated and which AI model produced it.
Before you can use it
Not seeing a briefing, or told it is "not configured"? AI Briefing only works once an AI provider is connected for your tenant. An administrator sets this up once under Settings → General → LLM — see Settings › Connect an AI provider for the step-by-step. For briefings, choose OpenAI or Anthropic (Gemini is not supported for briefings yet).
AI Briefing runs on your own AI provider key — the same BYO-LLM ("bring your own" AI) setup that also powers call summaries and the Voice Agent assistant. If it is not set up yet, clicking Generate shows a short message linking you to Settings → General → LLM to connect one. OpenAI, Anthropic, and Gemini all work for briefings.
Each briefing counts toward the same shared monthly AI budget as call summaries and the Voice Agent assistant. If you have set a hard budget cap and it has been reached, generation is paused until the next month or until you raise the cap in Settings. Only usage figures are recorded (tokens, cost, and the model used) — your call content, the prompt, and the briefing text itself are never stored.
Headline metrics
In Calm view, three cards carry the essentials:
- Calls — total for the range, the change versus the previous period, and the split across inbound / outbound / internal.
- Answered — the answer rate as a percentage, how many of the total were picked up, and how many were missed versus abandoned.
- Avg talk time — average call length, with the total talk time for the period and how many recordings were captured.
Full view breaks the same totals into separate tiles — Total calls, Inbound, Outbound, Internal, and Abandoned — each with its change versus the previous period.
Activity over time
- Calls per day (Calm) — a bar per day across the range, split into Answered and Missed, so you can see which days were busy and where calls slipped.
- Hourly distribution (Full) — today's calls bucketed by hour across inbound, outbound, internal, and abandoned, for spotting the busy parts of the day.
Quality and sentiment
- Worth a listen (Calm) — recorded calls surfaced automatically by sentiment, MOS (call-quality score), and length, so the calls most worth reviewing rise to the top. Each links through to the recording in Call Analytics.
- Sentiment trend (Full) — the trend of caller sentiment across recorded, transcribed calls. It needs a handful of transcribed calls before it has enough data to plot.
Call-quality scores (MOS) and sentiment come from the same analysis that powers Call Analytics; see that chapter for how they are produced.
Live status
- Live (Calm) / Active calls right now (Full) — how many calls are in progress this instant, updating on its own (polled every few seconds). When nothing is happening it simply reads idle.
Busiest extensions
- Busiest extension (Calm) / Top extensions (Full) — who handled the most calls in the range, with their inbound/outbound split, total talk time, and average MOS. View all extensions → opens the full list. A quick way to see where call load is concentrated.
Recent calls
A short table of the latest calls — time, from → to, direction, status, duration, and MOS — with View all → into Call Analytics for the complete, searchable record. It is the fastest way to answer "what just happened?"
System health
Full view adds a System health panel covering the back-end services behind your calls:
- Transcription queue — how many recordings are waiting to be transcribed.
- Transcription pipeline — whether transcription is running normally.
- Call records — recent call-record activity (and when the last call was).
- Recordings storage — the state of recording storage.
These are status indicators only — green means the service is healthy. If something here is impaired and it affects you, it is worth a note to support with your tenant name (shown in the workspace footer — see Getting around).
Next: Directory — the people behind all these numbers.